Firewalld Configuration on Debian
Overview of Firewalld configuration on Debian Firewalld serves as a front-end to the Linux kernel’s netfilter framework, providing a dynamic interface for managing.

Overview of Firewalld configuration on Debian Firewalld serves as a front-end to the Linux kernel’s netfilter framework, providing a dynamic interface for managing.
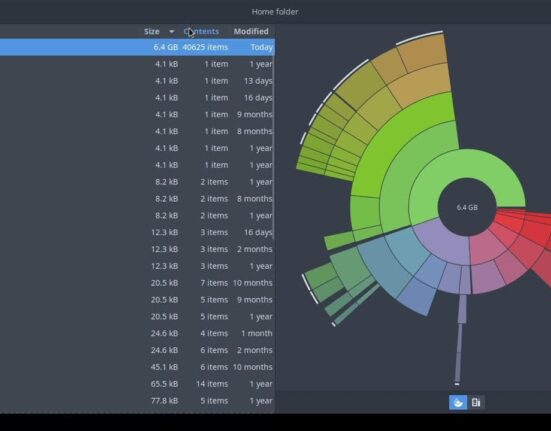
Tutorial Overview Learn to analyze and manage disk space usage using df, du, and ncdu on Debian-based systems. These tools help identify storage.

Two storage servers will use DRBD to replicate data and GlusterFS for sharing directories between MongoDB and Web Servers. Prerequisites Step-by-Step Guide Step 1: Install DRBD and.

Introduction Artificial Intelligence (AI) has revolutionized industries by automating processes, enhancing decision-making, and improving efficiency. However, AI is not without its challenges—particularly when.

Tutorial Overview This tutorial describes how to restore files, directories, and databases from backups, focusing on both rsync file backups and mysqldump database.
Overview of the HAProxy Cluster Setup This article walks through a two-node HAProxy cluster setup with high availability using Keepalived. It covers configuring.

Prerequisites: Step 1: Create the Script The script: Step 2: Install Dependencies Open your command line or terminal and navigate to the directory.
Overview This guide provides a comprehensive look at creating and managing databases in MySQL. MySQL is one of the most popular relational database.

Introduction With the rapid evolution of cyber threats, organizations need a proactive approach to security. Cybersecurity Threat Intelligence (CTI) helps businesses identify, analyze,.
Mouse Movement Simulator for Windows is a detailed step-by-step tutorial on how to create, configure, and use the MoveMouse.ps1 PowerShell script to simulate mouse movement.