User Accounts: Create and Manage
Tutorial Overview This tutorial explains how to create, manage, and configure user accounts on a Debian-based system. You’ll learn how to add new.

Tutorial Overview This tutorial explains how to create, manage, and configure user accounts on a Debian-based system. You’ll learn how to add new.

Overview of Firewalld configuration on Debian Firewalld serves as a front-end to the Linux kernel’s netfilter framework, providing a dynamic interface for managing.

Overview of Graylog Log Aggregation Cluster A Graylog Log Aggregation Cluster allows centralized log management, making it easier to analyze and monitor system.
Overview of network monitoring on Debian 12 This tutorial explains network monitoring on Debian 12 using netstat, ss, and iftop. These tools help.

Introduction Quantum computing is reshaping the future of technology by offering unprecedented computational power, capable of solving problems that are infeasible for classical.

Introduction As artificial intelligence (AI) rapidly evolves, so does its dual-use potential. While AI enables transformative benefits across industries—from healthcare to finance—it also.
In this Extended Terraform Tutorial, we’ll guide you through the process of deploying scalable infrastructure on AWS using Terraform. This tutorial covers everything.

Ensuring data privacy and compliance in cloud environments requires a strategic approach that integrates technical safeguards, organizational policies, and legal frameworks. This comprehensive.
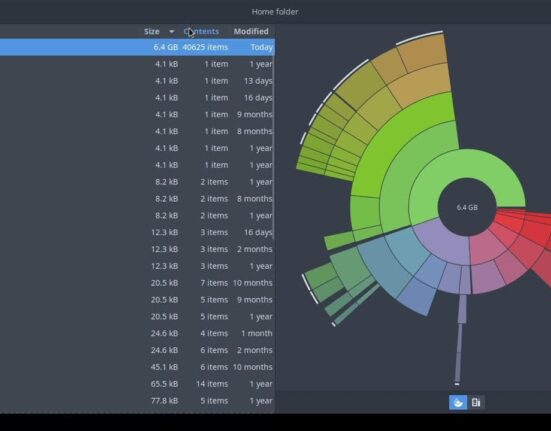
Tutorial Overview Learn to analyze and manage disk space usage using df, du, and ncdu on Debian-based systems. These tools help identify storage.
Two web servers will be load-balanced using HAProxy. Prerequisites Step-by-Step Guide Step 1: Install Apache or Nginx on Web Servers 1. Install Apache or Nginx: Step 2:.